v.boxplot
Draws a boxplot of values from a specified attribute column in a vector dataset, with an optional grouping based on categories in another column.
v.boxplot [-hnrgo] map=name [layer=string] column=name [group_by=name] [where=sql_query] [output=name] [plot_dimensions=string] [dpi=integer] [fontsize=integer] [title=string] [order=string] [style=string] [axis_limits=string] [box_color=name] [box_bordercolor=name] [box_width=float] [box_linewidth=float] [whisker_linewidth=float] [median_linewidth=float] [median_color=name] [flier_marker=string] [flier_size=float] [flier_color=name] [map_outliers=name] [overlap_basis=string] [--overwrite] [--verbose] [--quiet] [--qq] [--ui]
Example:
v.boxplot map=name column=name
grass.tools.Tools.v_boxplot(map, layer="1", column, group_by=None, where=None, output=None, plot_dimensions=None, dpi=100, fontsize=None, title=None, order=None, style=None, axis_limits=None, box_color="", box_bordercolor="", box_width=None, box_linewidth=None, whisker_linewidth=None, median_linewidth=None, median_color="", flier_marker="o", flier_size=None, flier_color="", map_outliers=None, overlap_basis="whisker", flags=None, overwrite=None, verbose=None, quiet=None, superquiet=None)
Example:
tools = Tools()
tools.v_boxplot(map="name", column="name")
This grass.tools API is experimental in version 8.5 and expected to be stable in version 8.6.
grass.script.run_command("v.boxplot", map, layer="1", column, group_by=None, where=None, output=None, plot_dimensions=None, dpi=100, fontsize=None, title=None, order=None, style=None, axis_limits=None, box_color="", box_bordercolor="", box_width=None, box_linewidth=None, whisker_linewidth=None, median_linewidth=None, median_color="", flier_marker="o", flier_size=None, flier_color="", map_outliers=None, overlap_basis="whisker", flags=None, overwrite=None, verbose=None, quiet=None, superquiet=None)
Example:
gs.run_command("v.boxplot", map="name", column="name")
Parameters
map=name [required]
Name of vector map
Or data source for direct OGR access
layer=string
Layer number or name
Vector features can have category values in different layers. This number determines which layer to use. When used with direct OGR access this is the layer name.
Default: 1
column=name [required]
Attribute column value to be plotted
group_by=name
Attribute column with categories to group the data by
where=sql_query
WHERE conditions of SQL statement without 'where' keyword
Example: income < 1000 and population >= 10000
output=name
Name of output image file
Name for output file
plot_dimensions=string
Plot dimensions
Dimensions (width,height) of the figure in inches
dpi=integer
DPI
resolution of plot
Default: 100
fontsize=integer
Font size
Default font size
title=string
Plot title
The title of the plot. If left empty, no title is drawn.
order=string
Sort boxplots
Sort boxplots based on their median values
Allowed values: descending, ascending
style=string
Matplotlib style
Matplotlib style sheet, see https://matplotlib.org/stable/gallery/style_sheets/style_sheets_reference.html
axis_limits=string
Limit value axis [min,max]
min and max value of y-axis, or x-axis if -h flag is set)
box_color=name
Color of the boxplots
Fill color of the boxplots. Unset leaves the boxes unfilled (Matplotlib default).
box_bordercolor=name
Color of the borders of the boxplots
Color of the borderlines of the boxplots. Defaults to the Matplotlib default.
box_width=float
Boxplot width
The width of the boxplots (0,1]). Defaults to the Matplotlib default.
Allowed values: 0.1-1
box_linewidth=float
Boxplot line width
Width of the boxplot border lines. Defaults to the Matplotlib default.
whisker_linewidth=float
Whisker line width
Width of the whisker and cap lines. Defaults to the Matplotlib default.
median_linewidth=float
Median line width
width of the boxplot median line. Defaults to the Matplotlib default.
median_color=name
Color of the boxplot median line
Color of median. Defaults to the Matplotlib default.
flier_marker=string
Flier marker
Set flier marker (see https://matplotlib.org/stable/api/markers_api.html for options)
Default: o
flier_size=float
Flier size
Set the flier size. Defaults to the Matplotlib default.
flier_color=name
Flier color
Set the flier color. Defaults to the Matplotlib default.
map_outliers=name
Vector map with the outliers
Create a vector map with the outlier features, classified by how many other groups they overlap with (n_overlap), on which side and how far they lie from their own group (side, iqr_dist), with matching colors in a GRASSRGB column.
overlap_basis=string
Overlap basis
Range of the other groups an outlier is checked against to count overlaps: whisker (within the other group's whiskers/fences) or box (within its interquartile box)
Allowed values: whisker, box
Default: whisker
-h
horizontal boxplot(s)
Draw the boxplot horizontal
-n
notch
Draw boxplot(s) with notch
-r
Rotate labels
rotate x-axis labels
-g
Add grid lines
Add grid lines
-o
Include outliers
Draw boxplot(s) with outliers
--overwrite
Allow output files to overwrite existing files
--help
Print usage summary
--verbose
Verbose module output
--quiet
Quiet module output
--qq
Very quiet module output
--ui
Force launching GUI dialog
map : str, required
Name of vector map
Or data source for direct OGR access
Used as: input, vector, name
layer : str, optional
Layer number or name
Vector features can have category values in different layers. This number determines which layer to use. When used with direct OGR access this is the layer name.
Used as: input, layer
Default: 1
column : str, required
Attribute column value to be plotted
Used as: input, dbcolumn, name
group_by : str, optional
Attribute column with categories to group the data by
Used as: input, dbcolumn, name
where : str, optional
WHERE conditions of SQL statement without 'where' keyword
Example: income < 1000 and population >= 10000
Used as: input, sql_query, sql_query
output : str, optional
Name of output image file
Name for output file
Used as: output, file, name
plot_dimensions : str, optional
Plot dimensions
Dimensions (width,height) of the figure in inches
dpi : int, optional
DPI
resolution of plot
Default: 100
fontsize : int, optional
Font size
Default font size
title : str, optional
Plot title
The title of the plot. If left empty, no title is drawn.
order : str, optional
Sort boxplots
Sort boxplots based on their median values
Allowed values: descending, ascending
style : str, optional
Matplotlib style
Matplotlib style sheet, see https://matplotlib.org/stable/gallery/style_sheets/style_sheets_reference.html
axis_limits : str, optional
Limit value axis [min,max]
min and max value of y-axis, or x-axis if -h flag is set)
box_color : str, optional
Color of the boxplots
Fill color of the boxplots. Unset leaves the boxes unfilled (Matplotlib default).
Used as: input, color, name
box_bordercolor : str, optional
Color of the borders of the boxplots
Color of the borderlines of the boxplots. Defaults to the Matplotlib default.
Used as: input, color, name
box_width : float, optional
Boxplot width
The width of the boxplots (0,1]). Defaults to the Matplotlib default.
Allowed values: 0.1-1
box_linewidth : float, optional
Boxplot line width
Width of the boxplot border lines. Defaults to the Matplotlib default.
whisker_linewidth : float, optional
Whisker line width
Width of the whisker and cap lines. Defaults to the Matplotlib default.
median_linewidth : float, optional
Median line width
width of the boxplot median line. Defaults to the Matplotlib default.
median_color : str, optional
Color of the boxplot median line
Color of median. Defaults to the Matplotlib default.
Used as: input, color, name
flier_marker : str, optional
Flier marker
Set flier marker (see https://matplotlib.org/stable/api/markers_api.html for options)
Default: o
flier_size : float, optional
Flier size
Set the flier size. Defaults to the Matplotlib default.
flier_color : str, optional
Flier color
Set the flier color. Defaults to the Matplotlib default.
Used as: input, color, name
map_outliers : str, optional
Vector map with the outliers
Create a vector map with the outlier features, classified by how many other groups they overlap with (n_overlap), on which side and how far they lie from their own group (side, iqr_dist), with matching colors in a GRASSRGB column.
Used as: output, vector, name
overlap_basis : str, optional
Overlap basis
Range of the other groups an outlier is checked against to count overlaps: whisker (within the other group's whiskers/fences) or box (within its interquartile box)
Allowed values: whisker, box
Default: whisker
flags : str, optional
Allowed values: h, n, r, g, o
h
horizontal boxplot(s)
Draw the boxplot horizontal
n
notch
Draw boxplot(s) with notch
r
Rotate labels
rotate x-axis labels
g
Add grid lines
Add grid lines
o
Include outliers
Draw boxplot(s) with outliers
overwrite : bool, optional
Allow output files to overwrite existing files
Default: None
verbose : bool, optional
Verbose module output
Default: None
quiet : bool, optional
Quiet module output
Default: None
superquiet : bool, optional
Very quiet module output
Default: None
Returns:
result : grass.tools.support.ToolResult | None
If the tool produces text as standard output, a ToolResult object will be returned. Otherwise, None will be returned.
Raises:
grass.tools.ToolError: When the tool ended with an error.
map : str, required
Name of vector map
Or data source for direct OGR access
Used as: input, vector, name
layer : str, optional
Layer number or name
Vector features can have category values in different layers. This number determines which layer to use. When used with direct OGR access this is the layer name.
Used as: input, layer
Default: 1
column : str, required
Attribute column value to be plotted
Used as: input, dbcolumn, name
group_by : str, optional
Attribute column with categories to group the data by
Used as: input, dbcolumn, name
where : str, optional
WHERE conditions of SQL statement without 'where' keyword
Example: income < 1000 and population >= 10000
Used as: input, sql_query, sql_query
output : str, optional
Name of output image file
Name for output file
Used as: output, file, name
plot_dimensions : str, optional
Plot dimensions
Dimensions (width,height) of the figure in inches
dpi : int, optional
DPI
resolution of plot
Default: 100
fontsize : int, optional
Font size
Default font size
title : str, optional
Plot title
The title of the plot. If left empty, no title is drawn.
order : str, optional
Sort boxplots
Sort boxplots based on their median values
Allowed values: descending, ascending
style : str, optional
Matplotlib style
Matplotlib style sheet, see https://matplotlib.org/stable/gallery/style_sheets/style_sheets_reference.html
axis_limits : str, optional
Limit value axis [min,max]
min and max value of y-axis, or x-axis if -h flag is set)
box_color : str, optional
Color of the boxplots
Fill color of the boxplots. Unset leaves the boxes unfilled (Matplotlib default).
Used as: input, color, name
box_bordercolor : str, optional
Color of the borders of the boxplots
Color of the borderlines of the boxplots. Defaults to the Matplotlib default.
Used as: input, color, name
box_width : float, optional
Boxplot width
The width of the boxplots (0,1]). Defaults to the Matplotlib default.
Allowed values: 0.1-1
box_linewidth : float, optional
Boxplot line width
Width of the boxplot border lines. Defaults to the Matplotlib default.
whisker_linewidth : float, optional
Whisker line width
Width of the whisker and cap lines. Defaults to the Matplotlib default.
median_linewidth : float, optional
Median line width
width of the boxplot median line. Defaults to the Matplotlib default.
median_color : str, optional
Color of the boxplot median line
Color of median. Defaults to the Matplotlib default.
Used as: input, color, name
flier_marker : str, optional
Flier marker
Set flier marker (see https://matplotlib.org/stable/api/markers_api.html for options)
Default: o
flier_size : float, optional
Flier size
Set the flier size. Defaults to the Matplotlib default.
flier_color : str, optional
Flier color
Set the flier color. Defaults to the Matplotlib default.
Used as: input, color, name
map_outliers : str, optional
Vector map with the outliers
Create a vector map with the outlier features, classified by how many other groups they overlap with (n_overlap), on which side and how far they lie from their own group (side, iqr_dist), with matching colors in a GRASSRGB column.
Used as: output, vector, name
overlap_basis : str, optional
Overlap basis
Range of the other groups an outlier is checked against to count overlaps: whisker (within the other group's whiskers/fences) or box (within its interquartile box)
Allowed values: whisker, box
Default: whisker
flags : str, optional
Allowed values: h, n, r, g, o
h
horizontal boxplot(s)
Draw the boxplot horizontal
n
notch
Draw boxplot(s) with notch
r
Rotate labels
rotate x-axis labels
g
Add grid lines
Add grid lines
o
Include outliers
Draw boxplot(s) with outliers
overwrite : bool, optional
Allow output files to overwrite existing files
Default: None
verbose : bool, optional
Verbose module output
Default: None
quiet : bool, optional
Quiet module output
Default: None
superquiet : bool, optional
Very quiet module output
Default: None
DESCRIPTION
The v.boxplot module draws a boxplot of the values in a vector map attribute column. Users can use the where option to select a subset of the attribute table. Values in the column can also be grouped according to the categories in another column (group_by), creating separate boxplots for each group.
Appearance
Options to customize the appearance of the plot include rotating the plot and
x-axis labels, adding notches, removing outliers, and defining the colors of
various boxplot components. By default, the resulting plot is displayed on the
screen. However, users can save the plot to a file by specifying the desired
width, height, and resolution. The format of the saved file is determined by the
provided file extension. For example, if output = outputfile.png, the plot
will be saved as a PNG file.
The style option applies a Matplotlib style sheet to the plot, e.g. style=ggplot.
Outlier map
Setting map_outliers creates a vector map with only features whose column value is a boxplot outlier. With group_by, outliers are computed separately per group. The output keeps the original attributes and adds:
- side:
loworhighoutlier. - iqr_dist: signed distance beyond the relevant fence, in IQR units.
- n_overlap: number of other groups whose value range contains the outlier.
- GRASSRGB: color string; high outliers are red, low outliers blue. More exceptional values are darker and more saturated.
overlap_basis defines the comparison range. With whisker, outliers are compared with other groups’ non-outlier range, between fences. With box, they are only compared with other groups’ interquartile range, Q1–Q3.
n_overlap is the number of other groups whose value range contains the outlier’s value. It distinguishes outliers that are exceptional relative to all groups (n_overlap = 0) from those that are unusual only within their own group (n_overlap > 0). For predicted classes, n_overlap > 0 marks features that may be difficult to classify because their values are typical of one or more other classes. In contrast, n_overlap = 0 marks values distinct from every other class. Mapping n_overlap therefore shows where class ambiguity is geographically concentrated.
NOTE
The outlier map is created in addition to the plot; both are derived from the same selection, so the exported outliers always match those shown in the figure. If the selection contains no outliers, the map is not created and a warning is issued.
EXAMPLE
Example 1
Use the vector layer schools_wake from the NC sample
dataset to create boxplots of the core
capacity of schools in Wake County, North Carolina. Use the Where clause to
exclude all records with no data. Use the -o flag to draw outliers.
v.boxplot -n -o map=schools_wake column=CORECAPACI where="CORECAPACI >0"
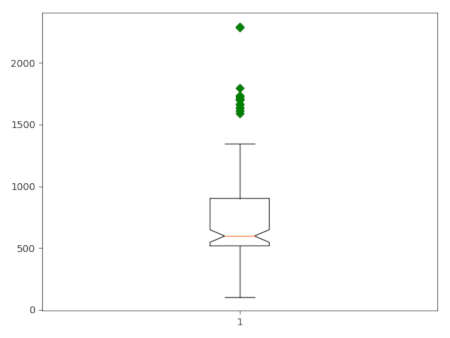 Figure 1: Boxplot of core capacity of schools in Wake County.
Example 2
Use the vector layeqr schools_wake from the NC sample
dataset to create boxplots of the core
capacity of the schools in Wake County, North Carolina, grouped by city. Use the
Where clause to exclude all records with missing data. Use the -o flag
to draw outliers.
v.boxplot -h -o map=schools_wake column=CORECAPACI where="CORECAPACI >0" group_by=ADDRCITY order=ascending
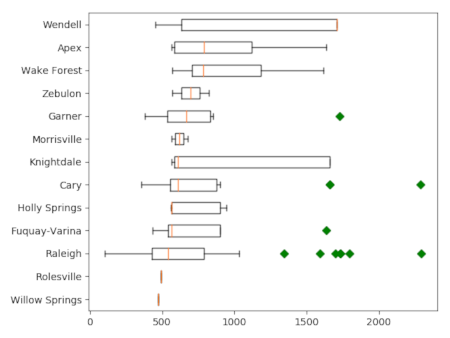 Figure 2: Boxplot of core capacity of schools in Wake County, grouped
by city.
Figure 2: Boxplot of core capacity of schools in Wake County, grouped
by city.
SEE ALSO
v.scatterplot, v.histogram, r.boxplot, r.series.boxplot, t.rast.boxplot, r.scatterplot r3.scatterplot
AUTHOR
Paulo van Breugel, HAS green academy, Innovative Biomonitoring research group, Climate-robust Landscapes research group
SOURCE CODE
Available at: v.boxplot source code
(history)
Latest change: Sunday Aug 02 19:20:49 2026 in commit 90b2b6d